Paste your numbers, pick a chart, and get a clean one-page report you can actually share.
One-time purchase · yours to keep · runs in any browser · your data never leaves your device
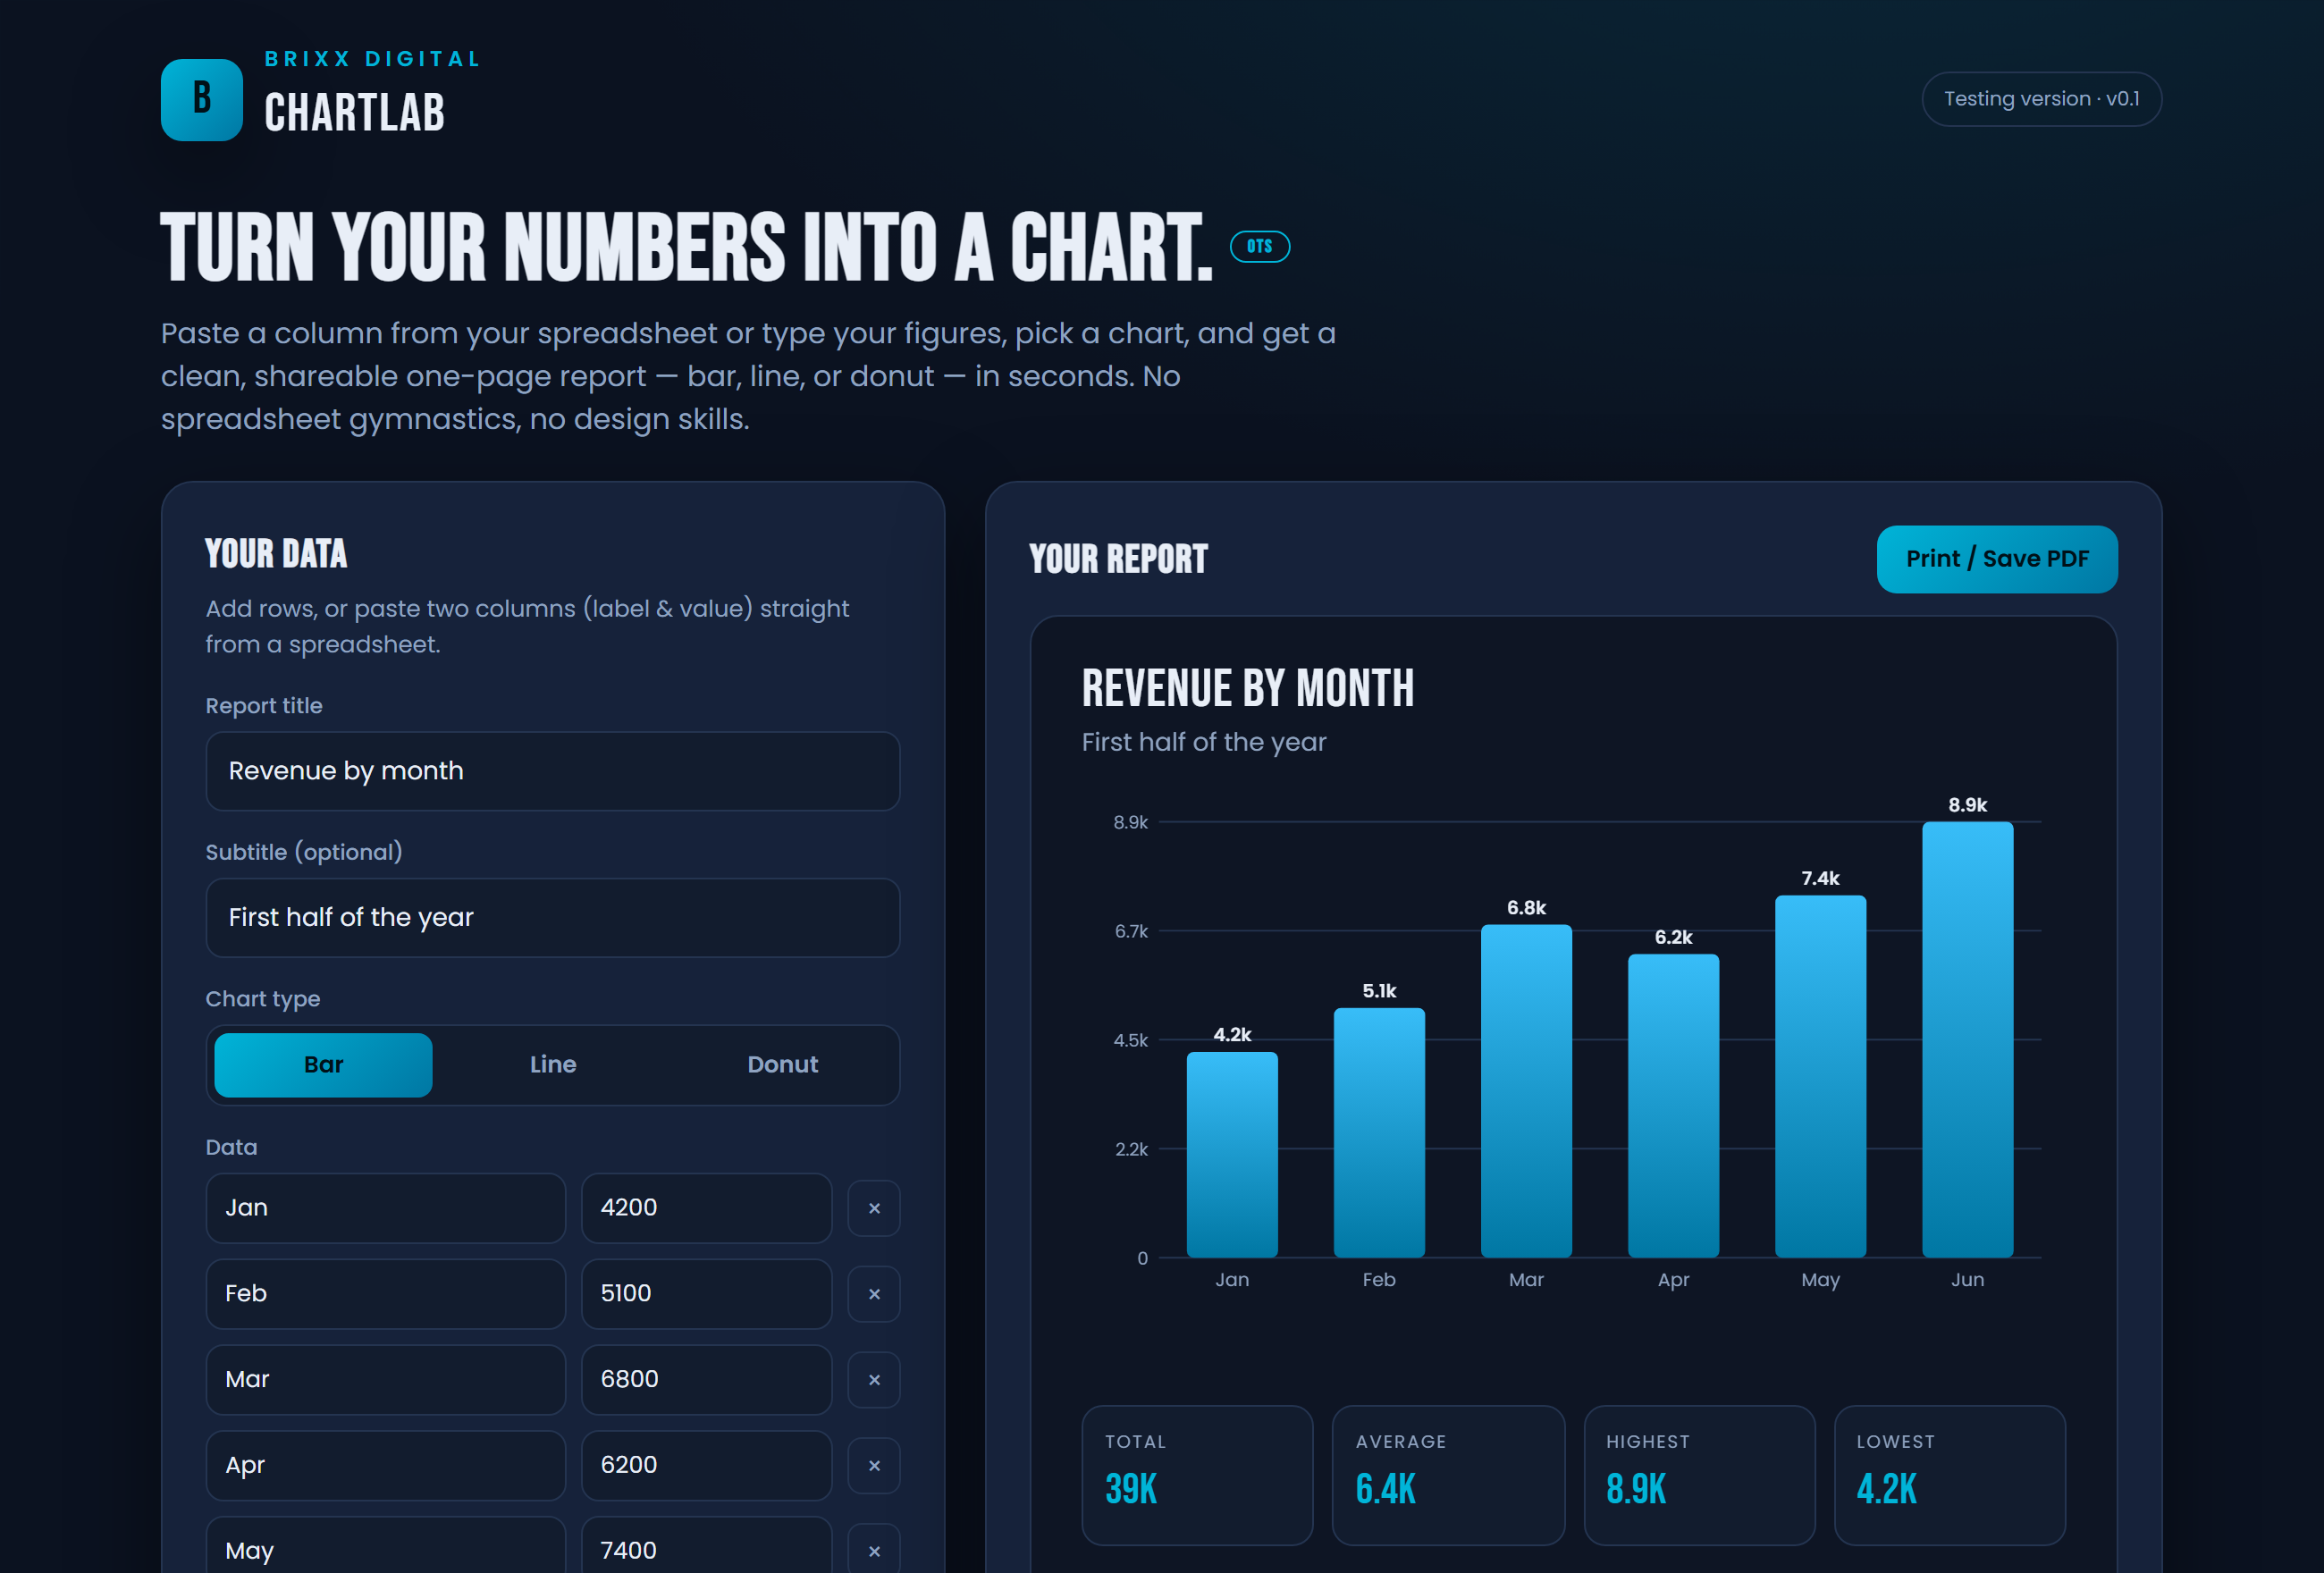
Getting a decent chart out of a spreadsheet is a fight — and the result usually still looks like a spreadsheet. ChartLab skips all that: paste a column of numbers or type them in, choose bar, line, or donut, and it draws a clean, on-brand chart in seconds.
It wraps the chart in a shareable one-page report — title, the key stats (total, average, high, low), and an auto-written takeaway — that you print or save as a PDF. No design skills, no chart wizard.
Type it in or paste two columns from a spreadsheet.
Bar, line, or donut — it redraws instantly.
Print or save the one-pager as a PDF.
Yes — one-time purchase, yours to keep.
Yes — everything renders in your browser, nothing uploaded.
Any label-and-number data — revenue by month, sales by rep, spend by category, survey results, you name it.
Yes — a dashboard wired to your real data is a custom build. Start with a free health check.
One-time purchase, yours to keep. Founding pricing — lock it in before it moves.